Mental Illness
mental_df =
  read_csv("./data/mental_data.csv") %>%
  janitor::clean_names() %>%
  mutate(
    any_mental_num = any_mental_num / 1000000,
    any_mental_per = any_mental_per * 100,
    ser_mental_num = ser_mental_num / 1000000,
    ser_mental_per = ser_mental_per * 100,
    state_abb = state.abb[match(state, state.name)],
    region = state.region[match(state, state.name)]
  ) %>%
  mutate(
    state_abb = replace(state_abb, state == "District of Columbia", "DC"))
State Map (2019-2020)
According to the mental health data collected between 2019 -2020, the mental illness percents are high in the US overall, with variations between states. Among them, Utah has the highest rate of mental illness, 29.7%; Florida has the lowest rate of mental illness, 17.5%.
state_mental=
  plot_usmap(
    data = mental_df,
    regions = "state",
    values = "any_mental_per",
    labels = TRUE, label_color = "white") +
  labs(
    title = "Percent of adults reporting any mental illness for each state, 2019-2022"
  ) +
  scale_fill_continuous(
    name = "Mental illness percent (%)",
    label = scales::comma) +
  theme(
    legend.position = "right",
    plot.title = element_text(size = 12))

ggplotly(state_mental)
Region Statistic (2019-2020)
Both any mental illness and serious mental illness are highest in the South, lowest in the Northeast. And the number of mental illness in the South is more than twice that of the Northeast.
any_mental_plot =
  mental_df %>%
    group_by(region) %>%
    drop_na() %>%
    summarize(any_mental_num = sum(any_mental_num)) %>%
    ggplot(
      aes(x = region, y = any_mental_num, fill = region)) +
    geom_bar(stat = "identity") +
    labs(
      title = "Any Mental Illness Number, by Region, 2019-2020",
      x = "Region",
      y = "Mental illness number (million)",
      fill = "Region") +
  theme(legend.position = "bottom")

ser_mental_plot =
  mental_df %>%
    group_by(region) %>%
    drop_na() %>%
    summarize(ser_mental_num = sum(ser_mental_num)) %>%
    ggplot(
      aes(x = region, y = ser_mental_num, fill = region)) +
    geom_bar(stat = "identity") +
    labs(
      title = "Serious Mental Illness Number, by Region, 2019-2020",
      x = "Region",
      y = "Mental illness number (million)",
      fill = "Region") +
    theme(legend.position = "bottom")

grid.arrange(any_mental_plot, ser_mental_plot, ncol =2) 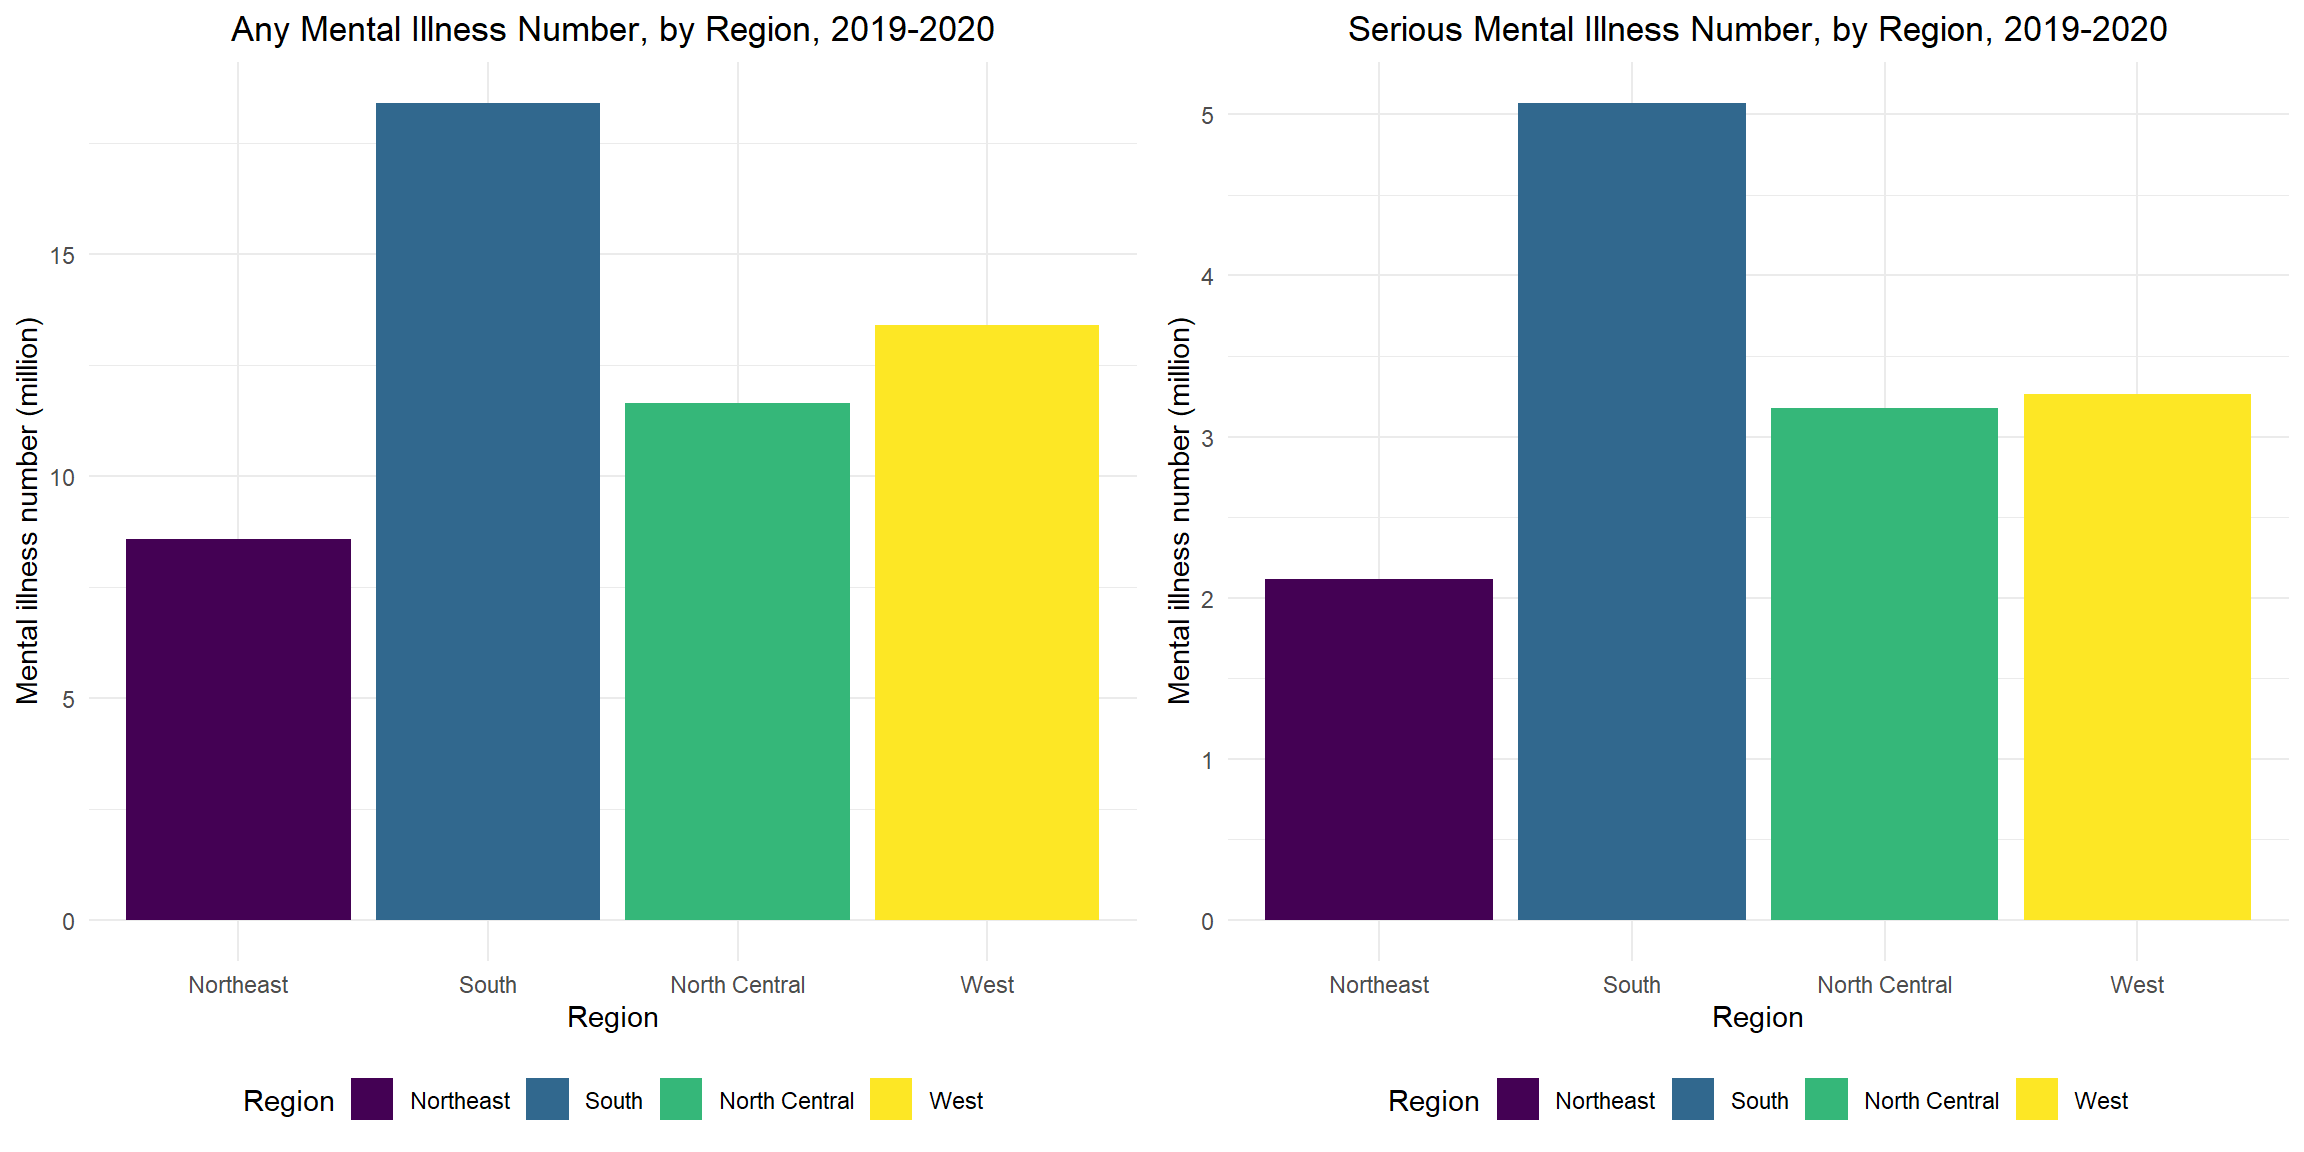
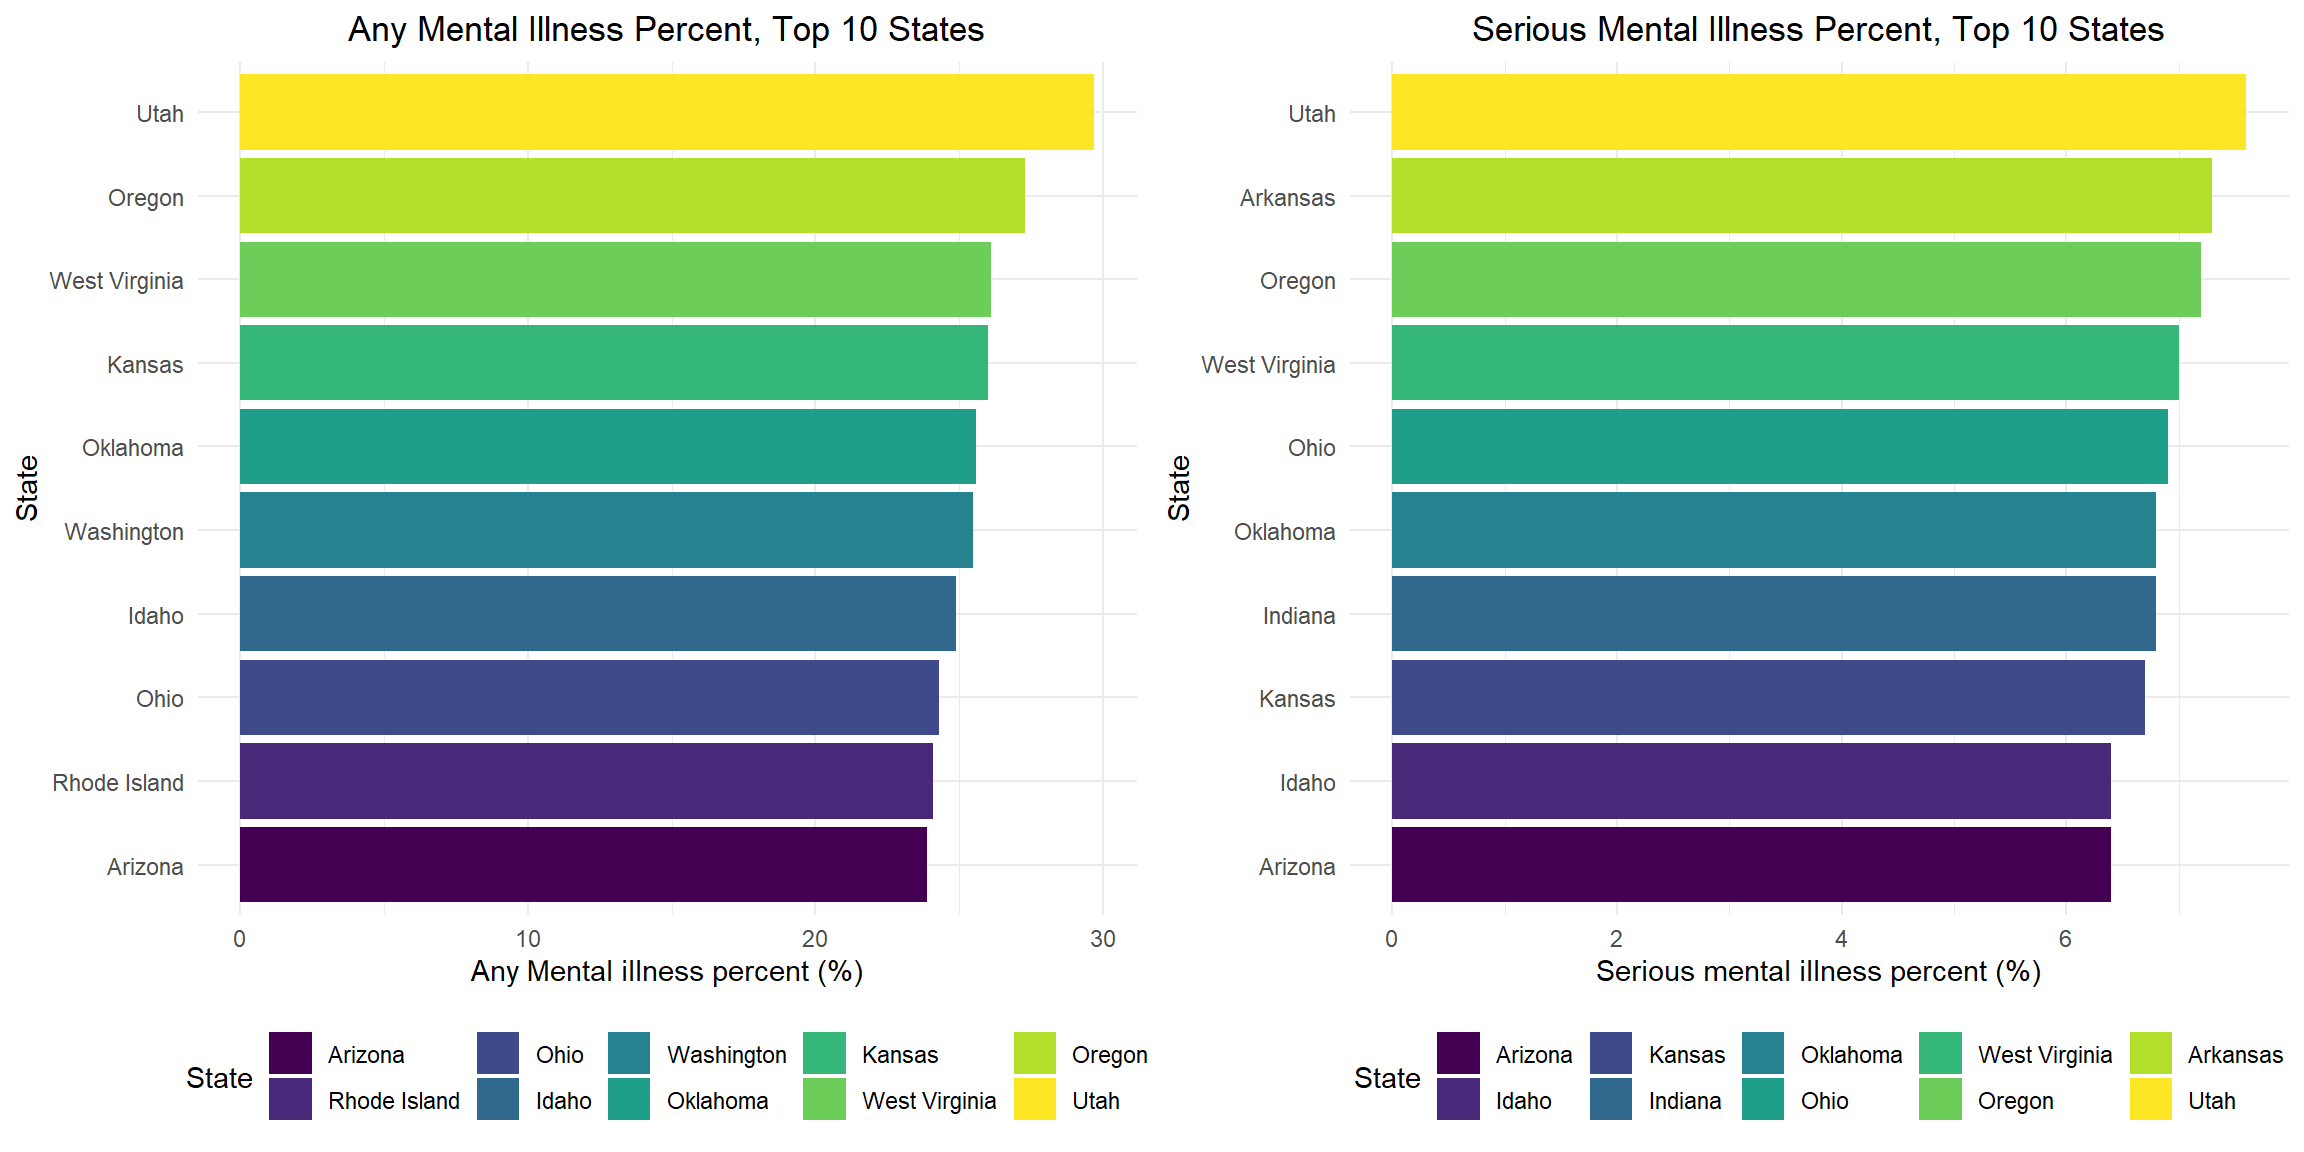
Top 10 States (2019-2020)
The top 10 states for any and serious mental illness are 8/10 the same, except Washington, Rhode Island, Arkansas and Indiana. Utah has the highest any/serious mental illness percent.
any_top10_plot =
  mental_df %>%
    filter(row_number(desc(any_mental_per)) <= 10) %>%
    mutate(
      state = fct_reorder(state, any_mental_per)
    ) %>%
    ggplot(
      aes(x = any_mental_per, y = state, fill = state)) +
      geom_bar(stat = "identity") +
      labs(
        title = "Any Mental Illness Percent, Top 10 States",
        x = "Any Mental illness percent (%)",
        y = "State",
        fill = "State") +
    theme(legend.position = "bottom")

ser_top10_plot =
  mental_df %>%
    filter(row_number(desc(ser_mental_per)) <= 10) %>%
    mutate(
      state = fct_reorder(state, ser_mental_per)
    ) %>%
    ggplot(
      aes(x = ser_mental_per, y = state, fill = state)) +
      geom_bar(stat = "identity") +
      labs(
        title = "Serious Mental Illness Percent, Top 10 States",
        x = "Serious mental illness percent (%)",
        y = "State",
      fill = "State") +
    theme(legend.position = "bottom")

grid.arrange(any_top10_plot, ser_top10_plot, ncol =2)